Taxsim is a tool from Daniel Feenberg for obtaining US federal and state income tax rates. It is powerful and versatile: it includes things like the core income tax, FICA taxes, EITC taxes, and COVID-era tax credits. Unfortunately it only goes back to 1960 for federal taxes. In an effort to visualize and understand US income tax rates back to its beginning during the US Civil war, I wrote taxFoo.jl. This is a barebones and simple package; it does not include capital gains taxes, EITC taxes, or tax credits. Even so, it does include core tax brackets, deductions, exemptions, and FICA taxes back to 1862, and matches Taxsim in many simple scenarios in the 1960s.
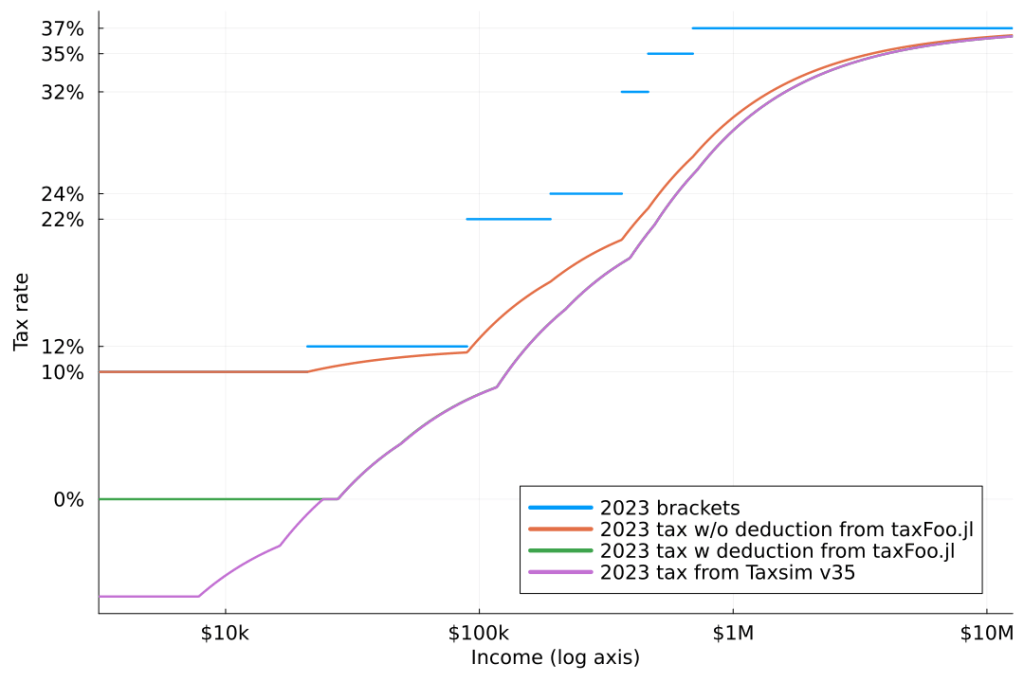
The plot above shows 2023 income tax brackets from, the effective tax rate implied by those brackets without any deductions, the effective tax rate with the standard deduction (all from taxFoo.jl), and finally the effective rate from Taxsim. All data are for the filing status “married filing jointly”, other filing statuses are similar. Taxsim includes the Earned income tax credit (EITC) which the taxFoo.jl curves do not; this is the reason for the difference between the Taxsim curve and the “tax w deduction from taxFoo.jl” curve at low incomes. In this plot FICA taxes are not included, while they are included in the figure below. The scenario used here is a simple one in which all income is wage income, with no other income such as capital gains. Note that the horizontal axis shows income on a logarithmic scale. We show the tax brackets for 2023 because Taxsim does not work for 2024.
Taxsim is superior to taxFoo.jl in all years for which it provides data; unfortunately it simply does not provide data prior to 1960. Since the tax code has become generally more complex since 1960, it is generally an easier task to implement the tax code prior to 1960 than after, which is what taxFoo.jl attempts to do. See the taxFoo.jl Readme for an animated plot which illustrates US wage income tax rates from the start of the income tax in 1860 to now; unfortunately that animated graph is a bit hard to follow. The following graph shows a subset of the full dataset: the income tax every forty years from 1863 to 2023. The income values are all inflation adjusted to 2024 dollars. The scenario is again a married couple filing jointly with only wage income (other filing statuses are similar). Social Security and Medicare (FICA) taxes in the form of employee and employer contributions are included for all years in which they are in effect (after 1937).
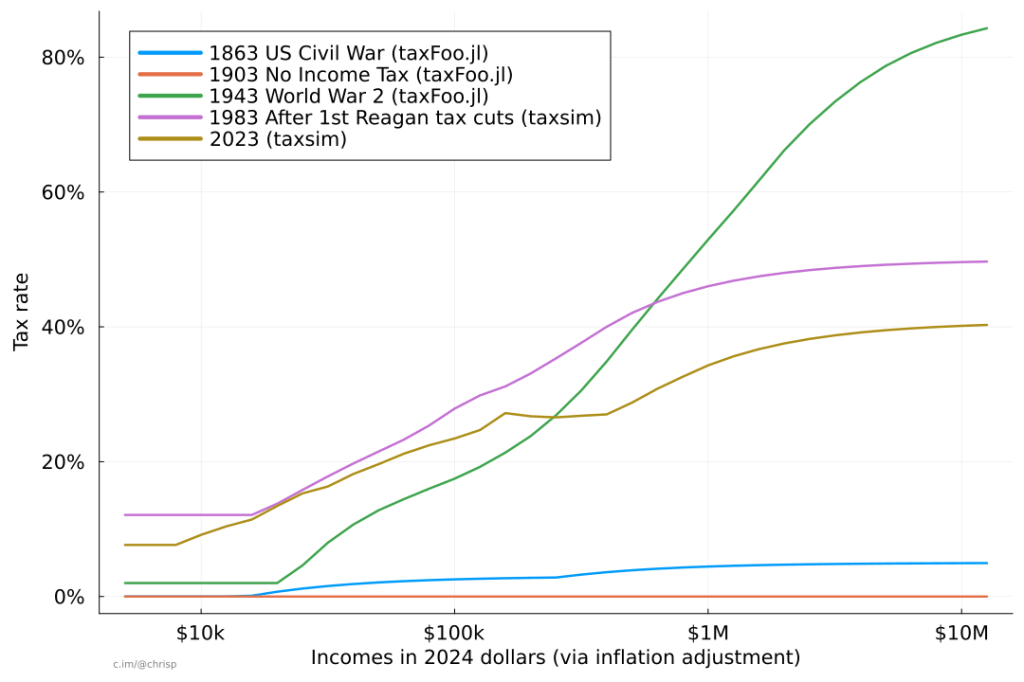
The figure shows the relatively low income tax during the US Civil war when the income tax was first implemented. After the war the income tax was repealed, and the US went back to funding the government via tariffs; thus we see no income tax in 1903. In the late 1800s and early 1900s the income tax was a hot topic, culminating in the 16th amendment which was ratified in 1913. In the figure, the wartime 1943 curve is the sole representative of the era from 1917 to 1980s of higher taxes on the highest incomes. Finally, in 2023 we see a rate curve that is representative of recent tax rates. In the figure, taxFoo.jl is used for 1863, 1903, and 1943, while Taxsim is used for 1983 and 2023
Before thinking about how we might change the tax policy in the US, it is useful to look at how our taxes were structured in the past. Until a better tool gives data for all years, I’ll use taxFoo.jl for tax data prior to 1960, and Taxsim after 1960 to understand tax data.
